All topics
The network drive
Files and websites
Cameras and sensors
Home and Sensor Data
NAS Reborn reads the instruments of the device itself and, on newer devices, your Apple Home accessories. It keeps their history and hands both to template sites as ordinary template values.
What the device itself measures
The phone has these built in. You turn on the ones you want in the picker of the Sensor dashboard example.
- Air pressure from the barometer, in hPa, on devices that have one. A falling trend means weather is on the way.
- Mains power, meaning whether the device is on the charger or on battery, with every flip recorded as an event. "On battery since 14:32" is a power-cut log that nothing else in the house is keeping. The charge percentage is recorded as well, so you can chart the drain curve.
- Movement, recorded as an event whenever the device is picked up or knocked off its shelf.
- Room noise from the microphone, in dB below the loudest sound it can take in, so readings are negative and rise toward zero as the room gets louder.
A Mac offers the power and noise readings, with a desktop reporting mains, and lacks a barometer and a movement sensor.
Apple Home accessories
The app can also read the accessories already in your Home, such as temperature and humidity sensors, contact and motion sensors, light sensors, leak, smoke and carbon monoxide detectors, locks, security systems, and switches and their state. You pick them per room in the app and each one becomes a value your pages can print.
Reading them in a page
Accessories arrive as a home object and the instruments of the device as
device.sensors:
{{ home.hallway.temperature }} °C in the hallway
{{ device.sensors.pressure }} hPa, {{ device.sensors.noise }} dB
{% for a in home.accessories %}{{ a.name }}{% endfor %}
A page is rendered again when a value it printed has moved, and pages that read no readings are not affected.
History and charts
Readings are recorded on the device, minute by minute for 48 hours and then as
hourly figures going back around 400 days. A page reaches them through
history on the accessory, with points every ten minutes for the last 48
hours, hourly statistics for the last 14 days and daily statistics for the
long one, which is enough to draw a chart from the device alone.
{% assign series = home.hallway.history.temperature %}
The Sensor Dashboard example
The quickest start is Add example → Sensor dashboard… on the Content tab.
Pick the accessories you want and it writes a working site with a tile per
reading with meters and charts, a readings.json endpoint, and tiles that
update themselves over a live stream rather than reloading the page.
Everything it writes is ordinary template source you can edit.
Sensitive readings stay off the open web
Some readings say whether anyone is home: motion, occupancy, contact, locks, security state, the noise level from the microphone, and the location of the house. Temperature, humidity, air pressure, power, leaks and battery do not and are treated as ordinary values.
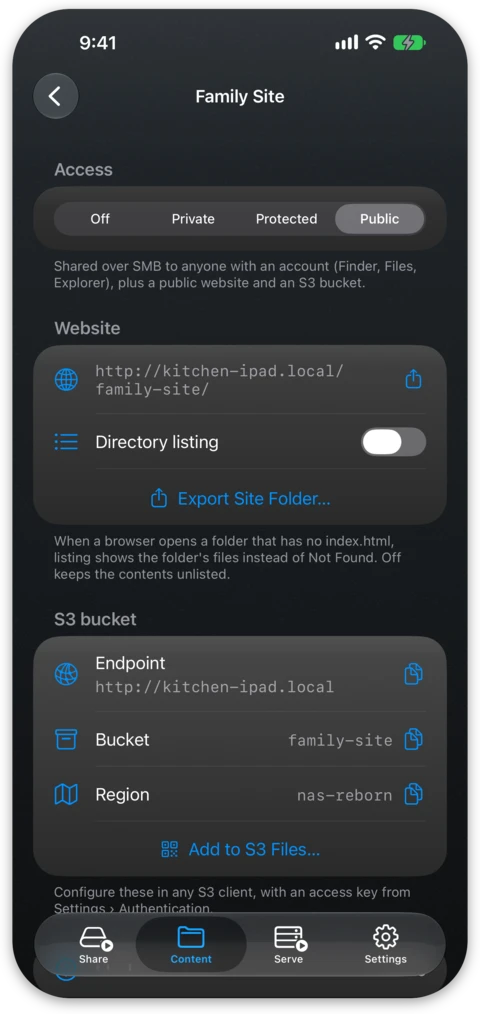
On a public folder, a page reading a sensitive value is served only once you turn on Serve sensitive data on that folder's screen. Until then the page is replaced by a short refusal that keeps the accessory and the value to itself.
The Sensor Dashboard example is created protected, so it works for your household straight away and faces the internet only when you decide it should.